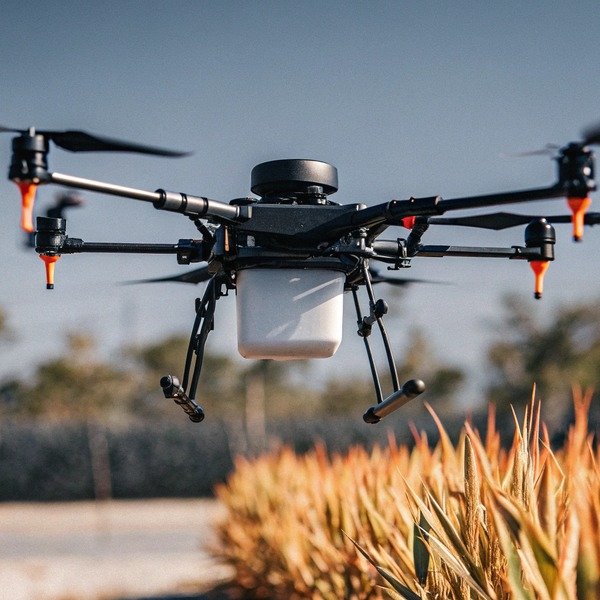
When we test our latest SkyRover prototypes in Xi’an, we see how quickly a heavy payload drains batteries air resistance, or ‘drag’ 1. heavy payload 2 Choosing the wrong flight specs can ruin your workday efficiency.
To evaluate energy consumption, compare manufacturer specifications for hovering versus cruising power draw, aiming for a ratio below 1.5:1. Prioritize models offering autonomous waypoint planning features, as these modes typically reduce energy usage by 30-50% compared to manual hovering, significantly extending operational time per charge.
Let’s look at the specific modes affecting your buying decision.
How does energy consumption differ when I switch between static hovering and constant-speed cruising?
Our engineering team constantly monitors motor output data during static tests. Hovering fights gravity directly, which often catches new buyers off guard when they see the battery drop.
Hovering consumes 30-50% more energy than constant-speed cruising because the motors must generate maximum vertical thrust to fight gravity without aerodynamic lift. Cruising allows the drone to utilize forward momentum and rotor tilt, significantly reducing the electrical current required to maintain altitude and stability.

When we analyze the flight logs from our factory testing grounds, the data tells a clear story. Keeping a drone in one spot is the most expensive action you can take in terms of power. This surprises many of our customers. They often assume that moving fast uses more energy. In reality, staying still is hard work for a multi-rotor aircraft.
The Physics of Fighting Gravity
When a drone hovers, the propellers must push air straight down. They have to support 100% of the drone's weight using raw motor power. There is no help from the wind or forward motion. The motors run at a high RPM (revolutions per minute) constantly. This creates a massive demand on the battery.
In contrast, when the drone enters a cruising mode, it tilts forward. The air flows over the body and propellers differently. This creates a small amount of aerodynamic lift. aerodynamic lift 3 It is similar to how a bird glides. The motors do not have to work as hard to keep the drone in the air. We often see current draw drop significantly the moment the drone starts moving forward at a steady pace.
Why This Matters for Your Wallet
If you plan to use your drone for spot spraying, this is critical. Spot spraying involves a lot of hovering. You stop over a weed, spray, and move on. This style of flight will drain your battery much faster than blanket spraying. When you buy a drone, you must look at the "hover time" spec separately from the "max flight time." Manufacturers often list the max time based on optimal cruising conditions.
If your farm requires you to inspect crops by hovering over specific plants, you need a bigger battery. If you just need to map a large field, you can get away with a smaller power setup. We always advise our clients to check the kilowatt (kW) draw for both modes.
Comparing Power Draw
The table below shows typical data we see in mid-sized agricultural drones. Note the sharp difference in power required for hovering versus cruising.
| Flight Mode | Power Draw (kW) | Estimated Flight Time (min) | Primary Motor Stressor |
|---|---|---|---|
| Static Hover | 4.0 – 5.0 kW | 10 – 15 min | Constant vertical thrust |
| Moderate Cruise | 2.0 – 3.0 kW | 18 – 25 min | Drag resistance |
| Transitioning | 3.5 – 4.5 kW | Variabel | RPM acceleration |
You can see that cruising requires almost half the power of hovering. This is why mapping missions cover so much more ground than inspection missions. When you evaluate a drone, ask the seller for these specific numbers. Do not settle for a generic "20 minutes" estimate. Ask them: "How many minutes at a dead hover?"
Do I save more energy using autonomous flight planning compared to manual pilot control?
We program our flight controllers to smooth out every turn because we know erratic manual flying wastes power. A human pilot simply cannot match the efficiency of our algorithms.
Autonomous flight planning saves significantly more energy than manual control by maintaining consistent speeds and optimizing turns. Algorithms eliminate the erratic throttle adjustments and redundant movements common in manual piloting, resulting in a 15-25% reduction in total battery consumption for the same coverage area.

I have seen many skilled pilots operate our SkyRover drones. Even the best pilots cannot beat a computer. When a human flies, they constantly adjust the sticks. They speed up, slow down, and overcorrect. Every time you accelerate, the motors pull a spike of current. These small spikes add up quickly over a 20-minute flight.
The Cost of Human Correction
Think about driving a car. If you constantly slam on the gas and then hit the brakes, you waste fuel. Manual drone piloting is the same. A pilot might overshoot a row of corn and have to fly back. Or they might fly too fast and have to brake hard to turn.
Autonomous flight plans use "smooth curves." autonomous flight plans 4 The drone does not stop at the end of a row. It flies a calculated curve to turn around. This maintains momentum. Keeping the drone moving is key to energy efficiency. The computer calculates the perfect speed to fly without wasting power computer calculates the perfect speed 5 on unnecessary acceleration.
Precision vs. Power
In our software development lab, we focus on path planning. We use algorithms to calculate the shortest route. A human pilot relies on their eyes. They might overlap rows too much, spraying the same area twice. This wastes battery and chemical payload.
An autonomous system uses GPS to fly exact lines. It ensures the drone only covers the area once. This efficiency translates directly to battery savings. You might finish a 10-hectare field with 20% battery left using auto mode. If you flew that same field manually, you might run out of power before finishing.
Efficiency Gains in Real Scenarios
We have compiled data from our customers in the US and Europe. The results consistently favor automation.
| Merkmal | Manual Control Impact | Autonomous Plan Impact | Energy Savings |
|---|---|---|---|
| Throttle Control | Erratic, high spikes | Smooth, constant | Hoch |
| Path Overlap | Inconsistent (10-30% waste) | Precise (<5% waste) | Mittel |
| Turning Style | Stop-and-turn (energy loss) | Banked coordinated turns | Hoch |
| Speed Consistency | Variabel | Optimized constant | Mittel |
When you are shopping for a drone, look at the software. Does it allow for easy mission planning? Can you set "banked turns" in the settings? These software features are just as important as the battery size. A smart drone will always fly longer than a dumb drone, even if they have the same hardware.
How does the battery discharge rate compare when I fly fully loaded versus returning empty?
During field trials in Chengdu, we measure voltage sag under max load. A full tank changes the physics entirely, demanding much higher amperage than an empty return flight.
Flying fully loaded drastically increases the battery discharge rate, often drawing 20-40% more current than flying empty due to the higher thrust-to-weight ratio required. As the payload decreases during spraying, the energy demand drops linearly, making the return-to-home leg the most energy-efficient part of the mission.

Weight is the enemy of flight time. This is a fundamental rule of aviation. In agricultural drones, the weight changes constantly. You take off heavy with a full tank of liquid. You land light after spraying. Understanding this cycle is vital for evaluating the drone's power system.
The Problem of Voltage Sag
When we design our power distribution boards, we have to account for "voltage sag." When a drone is heavy, the motors need more torque. To get torque, they pull more amps (current). When you pull high amps from a battery, the voltage drops temporarily. voltage drops temporarily 6
If you buy a cheap battery or a drone with poor power management, this sag can be dangerous. The drone might think the battery is empty just because the voltage dropped under load. We often see this with generic drones. The pilot takes off with a full tank, and two minutes later, the low-battery alarm sounds. The battery isn't empty, but it cannot handle the load.
Managing the Return Trip
The flight home is easy. The tank is empty. The drone is light. The motors barely have to work. However, you must plan your mission based on the heavy part of the flight. You cannot plan a mission assuming average power draw. You must assume maximum power draw for the first half of the flight.
We tell our procurement partners to look at the "Max Takeoff Weight" (MTOW) efficiency. Max Takeoff Weight 7 Many spec sheets only show hover time with no payload. That number is useless for agriculture. You need to know the flight time at MTOW.
Impact of Payload on Discharge
Here is how the numbers break down in a typical operation. We measured this using a 20-liter payload drone.
| Mission Phase | Payload Status | Current Draw (Amps) | Battery Stress Level |
|---|---|---|---|
| Takeoff & Climb | 100% Full | 120A – 140A | Critical (Highest Heat) |
| Spraying Run | 100% -> 0% | Decreasing (120A -> 80A) | High to Moderate |
| Return to Home | Empty | 60A – 70A | Niedrig |
| Landing | Empty | 75A | Niedrig |
Notice the massive difference between takeoff and return. The takeoff draws nearly double the current of the return trip. When you evaluate a drone, check if the battery cooling system is adequate. High discharge rates create heat. If the battery gets too hot during the "heavy" phase, it will degrade faster. You want a drone that can handle that initial high-stress phase without overheating.
Does flying at maximum speed for rapid coverage drain my battery significantly faster than moderate cruising?
When we export drones to large American farms, clients often ask for speed unlock codes. We warn them that pushing motors to the limit destroys efficiency ratings.
Flying at maximum speed drains batteries disproportionately faster due to the non-linear increase in aerodynamic drag. While covering ground quickly seems efficient, the exponential power required to overcome air resistance at top speeds significantly reduces total flight time compared to flying at a moderate, optimal cruise velocity.

There is a common myth that flying faster gets the job done sooner and saves battery. This is incorrect. Aerodynamics does not work in a straight line. If you double your speed, you do not just double the power needed. You might triple or quadruple it. This is due to air resistance, or "drag."
The Drag Penalty
At low speeds, drag is negligible. As you speed up, the air pushes back harder. The drone has to tilt at a steep angle to fight this wind resistance. This steep angle reduces the vertical lift from the propellers. reduces the vertical lift 8 So, the motors have to spin even faster just to keep the drone from falling.
This creates a "double penalty." The motors work hard to push forward und work hard to stay up. We call this the "parasitic drag" effect. In our flight tests, we identify an "optimal cruise speed." This is the sweet spot. It is usually around 60% to 70% of the drone's maximum speed.
Heat and Internal Resistance
Flying at max speed also damages your hardware. Continuous high-speed flight keeps the current draw at its peak. This generates immense heat in the motors, Electronic Speed Controllers (ESCs), and batteries.
Heat increases the internal resistance of the battery. internal resistance 9 Heat increases the internal resistance 10 This makes the battery less efficient. So, you are burning energy just to create waste heat. We advise our clients to lock their flight speeds. Covering 10 hectares at a moderate pace might take 2 minutes longer, but you will land with a cooler battery and more reserve power.
Why Moderate Speed Wins
When evaluating a drone, do not be impressed by high top speeds. A spray drone flying at 15 meters per second is likely spraying poorly and wasting energy. Look for a drone that is optimized for a working speed of 5 to 7 meters per second. This is where the efficiency lies.
If a manufacturer boasts about extreme speeds, ask them about the flight time at that speed. Usually, it is very short. Efficiency comes from balance, not raw speed.
Schlussfolgerung
Evaluating energy consumption requires looking beyond simple flight time estimates. You must consider the physics of hovering versus cruising, the efficiency of autonomous software, the impact of heavy liquid payloads, and the penalties of high-speed flight. By focusing on these specific modes and demanding detailed data from suppliers, you can choose a drone that offers true operational efficiency for your farm.
Fußnoten
1. NASA guide defining aerodynamic drag forces. ︎
2. FAA regulations often discuss weight and payload limits for commercial UAS operations. ︎
3. Explains the physics of lift mentioned in the context of drone cruising. ︎
4. Technical research on energy-efficient path planning for multi-rotor drones. ︎
5. IEEE research on energy-efficient UAV path planning algorithms. ︎
6. Technical explanation of voltage sag under high current loads. ︎
7. European aviation safety agency definitions for drone weight categories and regulations. ︎
8. FAA handbook explaining thrust vectors and lift reduction in forward flight. ︎
9. General background on how internal resistance affects battery efficiency and heat. ︎
10. Scientific overview of temperature impact on battery impedance. ︎