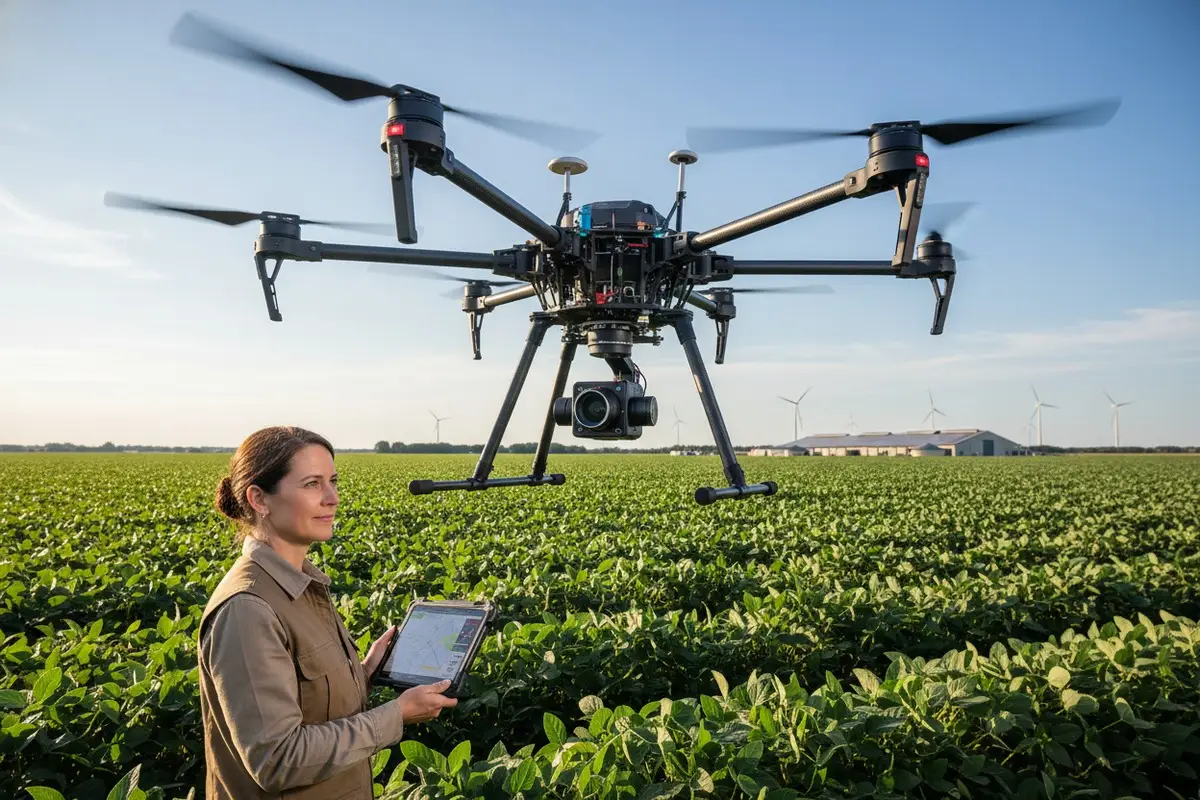

Jede Saison hört unser Produktionsteam die gleiche Frustration von Landwirten weltweit RTK-GPS-Fähigkeit 1. Sie investierten in Agrardrohnen 2 nur um festzustellen, dass ihr Spot-Spraying Ziele um Meter verfehlt. Verschwendete Chemikalien, beschädigte Pflanzen und verlorenes Geld sind die Folge Windschätzungsalgorithmen 3. Die Ursache? Sie haben die Schwebe-Genauigkeit vor dem Kauf nie richtig bewertet.
Um die Genauigkeit des Schwebens für die Spot-Sprühung zu bewerten, sollten Käufer die RTK-GPS-Fähigkeit überprüfen, die Zentimeter-Präzision liefert, die Schwebestabilität über 60 Sekunden testen, die Qualität des Flugreglers bewerten, reale Leistungsdaten unter verschiedenen Windbedingungen anfordern und bestätigen, dass die Drohne während des tatsächlichen Feldeinsatzes ihre Position innerhalb von 5-10 Zentimetern hält.
Die folgenden Abschnitte erläutern genau, was zu überprüfen ist, welche Fragen zu stellen sind und wie Marketingaussagen von tatsächlichen Leistungsdaten getrennt werden können.
Wie überprüfe ich, ob das RTK-Positionierungssystem präzise genug für meine Sprühzielanforderungen ist?
Wenn wir RTK-Module vor dem Versand kalibrieren, wird der Unterschied zwischen einem richtig konfigurierten System und einem einfachen GPS-Setup sofort deutlich. Viele Käufer gehen davon aus, dass alle Positionierungssysteme gleich gut funktionieren. Die Wahrheit erfahren sie erst, nachdem Pestizide auf gesunde Pflanzen getragen wurden.
Um die RTK-Präzision zu überprüfen, fordern Sie dokumentierte Testergebnisse an, die eine Genauigkeit im Zentimeterbereich im RTK-Modus zeigen, bestätigen Sie, dass das System Multi-Frequenz-GNSS-Empfänger in Verbindung mit taktischen IMUs verwendet, und fragen Sie, ob die Drohne mobile Basisstationen für abgelegene Gebiete ohne zuverlässige Internetverbindungen unterstützt.

RTK vs. Standard-GPS verstehen
Standard-GPS 4 bietet eine Genauigkeit von 2-5 Metern. Dies funktioniert gut für die großflächige Ausbringung. Für das Spot-Spraying versagt es vollständig. RTK (Real-Time Kinematic) GPS korrigiert Positionierungsfehler in Echtzeit mithilfe eines Referenzsignals einer Basisstation.
Unser Ingenieurteam hat Hunderte von Konfigurationen getestet. RTK-fähige Drohnen erreichen durchweg eine Genauigkeit von 2-5 Zentimetern. Zentimetergenauigkeit 5 Diese Präzision bedeutet den Unterschied zwischen der Behandlung eines kranken Flecks und der Kontamination umliegender gesunder Pflanzen.
Wichtige RTK-Spezifikationen zur Überprüfung
| Spezifikation | Minimum für Spot-Spraying | Optimale Leistung |
|---|---|---|
| Horizontale Genauigkeit | ±5 cm | ±2 cm |
| Vertikale Genauigkeit | ±10 cm | ±5 cm |
| RTK-Fix-Zeit | < 30 Sekunden | < 10 Sekunden |
| Basisstationsreichweite | 2 km | 5+ km |
| GNSS-Frequenzen | Zweifrequenz | Multifrequenz |
RTK-Leistung selbst testen
Führen Sie vor Abschluss eines Kaufs einen einfachen Test durch. Bitten Sie den Lieferanten um eine Demonstration von:
- Kaltstart-RTK-Fix-Erfassungszeit
- Positionshaltegenauigkeit über 60 Sekunden
- RTK-Wiederherstellung nach kurzem Signalverlust
- Leistung am Rande der Reichweite der Basisstation
Zeichnen Sie die Positionsdaten der Drohne während dieser Tests auf. Qualitätssysteme umfassen eine Flugbahnprotokollierungssoftware, die diese Daten zur Analyse exportiert. Wenn ein Lieferant diese Demonstration nicht anbieten kann, betrachten Sie dies als Warnsignal.
Überlegungen zur Basisstation
Viele landwirtschaftliche Betriebe finden in abgelegenen Gebieten statt. Nach unserer Erfahrung mit Lieferungen an Bauernhöfe im amerikanischen Mittleren Westen variiert die Internetverbindung zwischen den Feldern dramatisch. Fragen Sie die Lieferanten, ob ihr RTK-System Folgendes unterstützt:
- Netzwerk-RTK (erfordert Mobilfunkverbindung)
- Lokaler Basisstationsbetrieb (funktioniert unabhängig)
- Hybridmodus-Umschaltung
Drohnen, die ausschließlich auf Netzwerk-RTK angewiesen sind, verlieren in Gebieten mit schlechter Mobilfunkabdeckung an Präzision. Die Unterstützung lokaler Basisstationen gewährleistet eine konsistente Leistung unabhängig vom Standort.
Auf welche spezifischen Flugsteuerungsfunktionen sollte ich achten, um das Schwebe-Driften bei meinen Einsätzen zu minimieren?
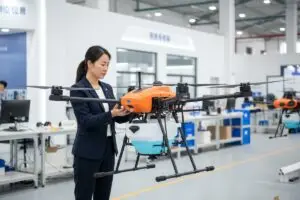
Während der Montage in unserer Anlage erleben wir hautnah, wie die Qualität des Flugcontrollers professionelle Drohnen von Konsumspielzeug unterscheidet, das als landwirtschaftliche Ausrüstung ausgegeben wird. Der Flugcontroller ist das Gehirn. Ein schwaches Gehirn kann kein stabiles Schweben aufrechterhalten, egal wie gut das GPS funktioniert.
Suchen Sie nach Flugsteuerungen mit hohen IMU-Abtastraten über 1000 Hz, redundanten Sensoreingängen, fortschrittlichen Filteralgorithmen zur Vibrationsunterdrückung und nachgewiesener Stabilität in landwirtschaftlichen Anwendungen mit dokumentierten Leistungsdaten über mehrere Saisons hinweg.

IMU-Qualität und Abtastraten
Die Trägheitsmessgerät 7 (IMU) erkennt Orientierungs- und Beschleunigungsänderungen. Höhere Abtastraten bedeuten eine schnellere Reaktion auf Störungen. Günstige Flugcontroller tasten mit 100-200 Hz ab. Professionelle Systeme überschreiten 1000 Hz.
Warum ist das wichtig? Ein 100-Hz-Controller erkennt Positionsänderungen alle 10 Millisekunden. Windböen, Sprühsystemvibrationen und Gewichtsverlagerungen treten schneller auf. Die Drohne driftet, bevor der Controller sie überhaupt bemerkt.
Anforderungen an die Sensorredundanz
Einzelpunktfehler führen zu Abstürzen. Qualitätsflugcontroller beinhalten:
| Sensor-Typ | Minimale Redundanz | Empfohlen |
|---|---|---|
| IMU | Dual | Triple |
| Barometer | Single | Dual |
| Magnetometer | Single | Dual |
| GPS/GNSS | Single | Dual |
Unsere Exportkunden in Europa fordern zunehmend redundante Dualsysteme zur Einhaltung von Vorschriften. Anforderungen an die Sensorredundanz 8 Auch dort, wo dies gesetzlich nicht vorgeschrieben ist, verbessert die Redundanz die Zuverlässigkeit bei kritischen Sprühvorgängen erheblich.
Vibrationsunterdrückungsfähigkeiten
Landwirtschaftliche Drohnen sind einzigartigen Vibrationsherausforderungen ausgesetzt. Sprühpumpen pulsieren. Motoren drehen sich mit unterschiedlichen Geschwindigkeiten, wenn sich die Tanks leeren. Rotoren erzeugen Harmonische.
Schlechte Flugsteuerungen interpretieren diese Vibrationen als Bewegung und überkorrigieren. Das Ergebnis? Unruhiges Schweben, das die Sprühgenauigkeit beeinträchtigt.
Fragen Sie Lieferanten nach:
- Vibrationsdämpfung an IMU-Halterungen
- Software-Filteralgorithmen
- Getestete Vibrationsverträglichkeitsspezifikationen
Höhenhaltemechanismen
Punktuelles Sprühen erfordert eine konstante Höhe über dem Pflanzenbestand. Qualitätskontrolleure integrieren mehrere Höhensensoren:
- Barometrische Drucksensoren
- Radar-Altimeter 9
- LiDAR-Sensoren
- Ultraschall-Entfernungsmesser
Jede Technologie hat Stärken und Schwächen. Radar funktioniert gut über dichtem Bewuchs. Ultraschall ist in niedrigen Höhen hervorragend. LiDAR bietet Präzision, hat aber Probleme mit Staub. Die besten Systeme verschmelzen Daten aus mehreren Quellen.
| Sensor-Typ | Beste Bedingungen | Einschränkungen |
|---|---|---|
| Radar | Dichter Bewuchs, bei jedem Wetter | Geringere Auflösung |
| LiDAR | Klare Bedingungen, hohe Präzision | Staubstörungen |
| Ultraschall | Niedrige Höhe, kurze Distanz | Begrenzte Reichweite, windabhängig |
| Barometrisch | Allgemeine Höhenreferenz | Beeinflusst durch Wetteränderungen |
Firmware-Update und Support
Die Leistung des Flugcontrollers verbessert sich durch Software-Updates. Fragen Sie die Lieferanten:
- Wie häufig wird die Firmware aktualisiert?
- Wie ist der Prozess der Update-Installation?
- Sind Updates für die gesamte Produktlebensdauer kostenlos?
- Können Updates vor Ort installiert werden?
Wenn wir in Zusammenarbeit mit Kunden neue Funktionen entwickeln, bestimmt die Flexibilität der Firmware, wie schnell Verbesserungen einsatzbereite Drohnen erreichen.
Wie kann ich die Schwebestabilität der Drohne beurteilen, wenn ich mit unvorhersehbaren Windverhältnissen zu kämpfen habe?
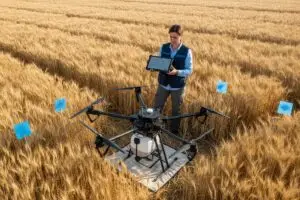
Unsere Testpiloten führen Windtests durch, bevor eine landwirtschaftliche Drohne das Werk verlässt. Wind ist der Feind der Schwebeflugpräzision. Die Herausforderung besteht darin, dass Marketingmaterialien die Leistung unter idealen Bedingungen zeigen. Echte Bauernhöfe haben echten Wind.
Bewerten Sie die Windstabilität, indem Sie Leistungsdaten bei mehreren Windgeschwindigkeiten bis zu 10 m/s anfordern, überprüfen, ob die Drohne Algorithmen zur Windgeschwindigkeitsabschätzung besitzt, die Motorschubreserven zur Störunterdrückung prüfen und tatsächliche Feldtests unter windigen Bedingungen vor dem Kauf durchführen oder miterleben.

Verständnis der Windeffekte auf den Schwebeflug
Wind drängt Drohnen vom Ziel weg. Die Flugsteuerung muss diese Bewegung erkennen und die Motoren anweisen, zu kompensieren. Drei Faktoren bestimmen den Erfolg:
- Erkennungsgeschwindigkeit – Wie schnell das System windinduzierte Abweichungen bemerkt
- Schubreserve – Ob die Motoren genügend Leistung haben, um zurückzudrücken
- Algorithmusqualität – Wie genau die Steuerung die erforderlichen Korrekturen vorhersagt
Günstige Drohnen haben oft keine ausreichenden Schubreserven. Sie schweben unter ruhigen Bedingungen akzeptabel, versagen aber, wenn der Wind zunimmt.
Windgeschwindigkeitsklassifizierungen für Tests
| Windkategorie | Geschwindigkeitsbereich | Erwartete Leistung |
|---|---|---|
| Ruhig | 0-2 m/s | Volle Präzision beibehalten |
| Licht | 2-5 m/s | Minimale Abweichung, schnelle Korrektur |
| Mäßig | 5-8 m/s | Spürbare Korrekturen, akzeptable Präzision |
| Stark | 8-10 m/s | Leistungsabfall beginnt |
| Sehr stark | >10 m/s | Betrieb sollte pausiert werden |
Wenn Kunden in landwirtschaftlichen Küstenregionen uns kontaktieren, wird die Windtoleranz zu ihrem Hauptanliegen. Wir empfehlen, Testdaten über mehrere Windkategorien hinweg anzufordern.
Motor- und Propellerüberlegungen
Das Schweben im Wind erfordert eine Schubreserve des Motors. Eine Drohne, die im ruhigen Zustand 70% Motorkapazität benötigt, hat 30% Reserve für Windkompensation. Eine Drohne mit 90% Kapazität hat nur 10% Reserve.
Lieferanten fragen nach:
- Maximales Startgewicht vs. empfohlenes Betriebsgewicht
- Schub-zu-Gewicht-Verhältnis des Motors bei typischen Sprühtanklasten
- Wirkungsgradkurven des Propellers
Unterdimensionierte Drohnen driften im Wind übermäßig, da die Motoren nicht schnell genug ausreichende Korrekturkräfte erzeugen können.
Aktive Windkompensationsfunktionen
Fortschrittliche Agrardrohnen umfassen:
- Windschätzungsalgorithmen – Berechnung von Windgeschwindigkeit und -richtung aus Flugdaten
- Vorausschauende Kompensation – Vorab-Anpassung an bekannte Windbedingungen
- Adaptive Regelverstärkungen – Automatische Erhöhung der Reaktionsaggressivität bei Wind
- Böenunterdrückungsmodi – Spezialisierte Handhabung für plötzliche Windänderungen
Während der Entwicklungszusammenarbeit mit unseren Kunden haben wir festgestellt, dass die Genauigkeit der Windschätzung direkt mit dem Erfolg der Spot-Sprühung unter schwierigen Bedingungen korreliert.
Feldtestprotokolle
Verlassen Sie sich nicht ausschließlich auf Herstellerangaben. Vereinbaren Sie tatsächliche Feldtests:
- Test unter ruhigen Morgenbedingungen (Basislinie)
- Test am Nachmittag, wenn sich thermische Winde entwickeln
- Erfassen Sie die Positionsdaten während beider Tests
- Vergleichen Sie Driftentfernungen und Korrekturzeiten
Wenn ein Lieferant Feldtestmöglichkeiten ablehnt, überdenken Sie den Kauf. Zuverlässige Hersteller stehen hinter ihren Leistungsversprechen mit Live-Demonstrationen.
Welche Fragen sollte ich meinem Lieferanten stellen, um sicherzustellen, dass seine Behauptungen zur Schwebe-Genauigkeit durch reale Daten untermauert sind?
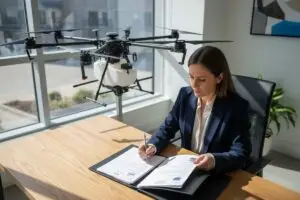
Nach dem Versand Tausender von Agrardrohnen weltweit wissen wir, welche Fragen informierte Käufer von denen trennen, die enttäuscht werden. Hersteller machen kühne Behauptungen. Ihre Aufgabe ist es, diese mit spezifischen, messbaren Beweisen zu überprüfen, die nicht gefälscht oder übertrieben werden können.
Bitten Sie Lieferanten um standardisierte 60-Sekunden-Schwebetest-Ergebnisse, fordern Sie Trajektoriendaten-Dateien von tatsächlichen Feldeinsätzen an, verlangen Sie Spezifikationen für die Genauigkeit unter angegebenen Windbedingungen, erkundigen Sie sich nach der verwendeten Testmethodik und Ausrüstung und überprüfen Sie die Behauptungen anhand unabhängiger Kundenreferenzen, die unter ähnlichen Bedingungen tätig sind.

Checkliste mit wichtigen Fragen
Bereiten Sie diese Fragen vor jedem Lieferantengespräch vor:
| Kategorie | Spezifische Frage | Was gute Antworten beinhalten |
|---|---|---|
| Testprotokoll | Wie messen Sie die Schwebe-Genauigkeit? | Standardisierte 60-Sekunden-Tests, Zentimeter-Präzisionsmessgeräte |
| Datenverfügbarkeit | Können Sie rohe Trajektoriendaten bereitstellen? | Ja, mit GPS/INS-Daten mit 10 Hz oder höher |
| Umgebungsbedingungen | Bei welchen Windgeschwindigkeiten wurden Tests durchgeführt? | Mehrere Tests bei mindestens 0, 5 und 8 m/s |
| Unabhängige Verifizierung | Kann ich aktuelle Kunden kontaktieren? | Ja, mit spezifischen Kontaktinformationen |
| Leistung in der Praxis | Welche Genauigkeitsverschlechterung tritt unter Feldbedingungen im Vergleich zu Labortests auf? | Ehrliche Einschätzung mit prozentualen Schätzungen |
Warnsignale in den Antworten des Lieferanten
Achten Sie auf diese Warnzeichen:
- Vage Genauigkeitsangaben – "Sehr genau" oder "branchenführend" ohne Zahlen
- Daten aus einzelnen Testbedingungen – Zeigt nur Ergebnisse unter idealen Umständen
- Unfähigkeit, Rohdaten bereitzustellen – Nur zusammengefasste oder handverlesene Ergebnisse
- Keine Kundenreferenzen – Behauptungen können nicht unabhängig verifiziert werden
- Abwehrende Reaktionen – Lieferanten, die detaillierten technischen Fragen ausweichen
In unseren Exportpartnerschaften stellen wir vollständige Trajektoriendaten aus standardisierten Tests zur Verfügung. Lieferanten, die dies nicht können, haben wahrscheinlich etwas zu verbergen.
Überprüfung der Testmethodik
Standardisierte Tests sollten Folgendes umfassen:
- Ausrüstungsspezifikationen – Welche Messgeräte wurden verwendet?
- Testdauer – Mindestens 60 Sekunden schwebendes Halten
- Wiederholung – Mehrere Tests, die Konsistenz zeigen
- Dokumentation der Bedingungen – Wind, Temperatur, Höhe aufgezeichnet
- Statistische Analyse – Mittelwert, Standardabweichung, maximale Abweichung
Fragen Sie, ob die Tests anerkannten Standards folgen. Die Agrardrohnenindustrie entwickelt Zertifizierungsprotokolle, die faire Vergleiche zwischen Herstellern ermöglichen.
Anforderungen an die Dokumentation
Fordern Sie diese Dokumente vor dem Kauf an:
- Berichte über Schwebegenauigkeitstests mit Rohdaten
- RTK-Positionierungsgenauigkeitszertifizierung
- Flugsteuerungs-Spezifikationen und Kalibrierungsaufzeichnungen
- Ergebnisse von Windkanal- oder Feldtests bei mehreren Windgeschwindigkeiten
- Kundenrezensionen mit überprüfbaren Kontaktinformationen
Verifizierung des Kundendienstes
Die Schwebegenauigkeit kann im Laufe der Zeit aufgrund von Folgendem abnehmen:
- IMU-Drift, die eine Neukalibrierung erfordert
- Beschädigung der GPS-Antenne
- Motorverschleiß, der die Schubkonsistenz beeinträchtigt
- Firmware-Fehler, die Updates erfordern
Fragen Sie Lieferanten nach:
- Verfügbarkeit von technischem Fernsupport
- Optionen für Kalibrierungsdienste
- Verfügbarkeit und Preise von Ersatzteilen
- Häufigkeit und Prozess von Firmware-Updates
- Garantieabdeckung für Genauigkeits-bezogene Probleme
Wenn wir mit Distributoren in den Vereinigten Staaten zusammenarbeiten, bestimmen die After-Sales-Supportfähigkeiten oft die langfristige Kundenzufriedenheit mehr als die anfänglichen Spezifikationen.
Fragen zur Kosten-Nutzen-Analyse
Verstehen Sie schließlich die Wirtschaftlichkeit:
- Welche Genauigkeitsverbesserung bietet ihr Premium-Modell gegenüber dem Basismodell?
- Ist der Genauigkeitsunterschied für Ihre spezifischen Sprühanwendungen bedeutsam?
- Welche betrieblichen Kosteneinsparungen ergeben sich aus verbesserter Präzision?
- Wie vergleichen sich Reparatur- und Wartungskosten über verschiedene Genauigkeitsstufen hinweg?
Bessere Schwebegenauigkeit reduziert Chemikalienverschwendung, verhindert Pflanzenschäden und verbessert die betriebliche Effizienz. Extreme Präzision über die betrieblichen Anforderungen hinaus verschwendet jedoch Geld.
Schlussfolgerung
Die Bewertung der Schwebegenauigkeit erfordert die Überprüfung der RTK-Präzision, die Beurteilung der Qualität des Flugreglers, die Prüfung der Windstabilität und die Forderung nach dokumentierten Nachweisen von Lieferanten. Nutzen Sie diese Richtlinien, um fundierte Kaufentscheidungen zu treffen, die Ihre Investition schützen.
Fußnoten
1. Erklärt die RTK-GPS-Technologie und ihre Anwendung für hochpräzise Landwirtschaft und Drohnen. ︎
2. Bietet einen breiten Überblick über landwirtschaftliche Drohnen und ihre Rolle in der Präzisionslandwirtschaft. ︎
3. Stellt adaptive Algorithmen zur Schätzung von Wind und aerodynamischem Widerstand für kleine unbemannte Luftfahrtsysteme vor. ︎
4. Beschreibt die typische Genauigkeit und die Leistungsstandards des Standard Positioning Service (SPS) GPS. ︎
5. Klärt die Bedeutung und Wichtigkeit von zentimetergenauer Genauigkeit bei der Drohnenkartierung. ︎
6. Erklärt die Vorteile von Mehrfrequenz- und Mehrkonstellations-GNSS-Empfängern für verbesserte Genauigkeit. ︎
7. Definiert ein IMU und seine Komponenten zur Messung von Bewegung und Ausrichtung. ︎
8. Erklärt das Konzept und die Bedeutung von Sensorredundanz für die Zuverlässigkeit und Fehlertoleranz von Drohnen. ︎
9. Wikipedia bietet einen umfassenden und maßgeblichen Überblick über Radarhöhenmesser, ihre Prinzipien und Anwendungen. ︎
Comments
No comments yet. Be the first to share your thoughts!
Leave a Comment