Seeing a drone frame crack after only a few months of operation is a frustrating and costly experience for any fleet manager battery swap 1. At our Xi’an testing facility, we have observed that standard commercial specifications often fail to account for the intense repetitive stress of daily agricultural schedules.
You must prioritize fatigue test reports showing at least 10,000 successful compression cycles at full payload. Crucial metrics include vertical impact resistance exceeding 5g loads, S-N curve data for material stress limits, and dynamic drop test results that simulate uneven terrain forces rather than just flat laboratory surfaces.
Let’s break down exactly what numbers you need to see on a technical specification sheet to ensure long-term reliability and return on investment.
What is the minimum number of cycle repetitions I should look for in a valid fatigue test report?
Many buyers overlook the sheer volume of landings an ag drone performs during a peak spraying season. When we certify our SkyRover models for export, we simulate years of abuse in just a few weeks to guarantee structural longevity. structural longevity 2
For high-frequency agricultural operations, valid fatigue reports must demonstrate a minimum of 10,000 to 15,000 successful load cycles without structural deformation. This volume replicates approximately three years of intensive daily use, accounting for the repetitive stress of automated battery swaps and liquid refilling stops common in modern farming.

Understanding the "Cycle" in Agriculture
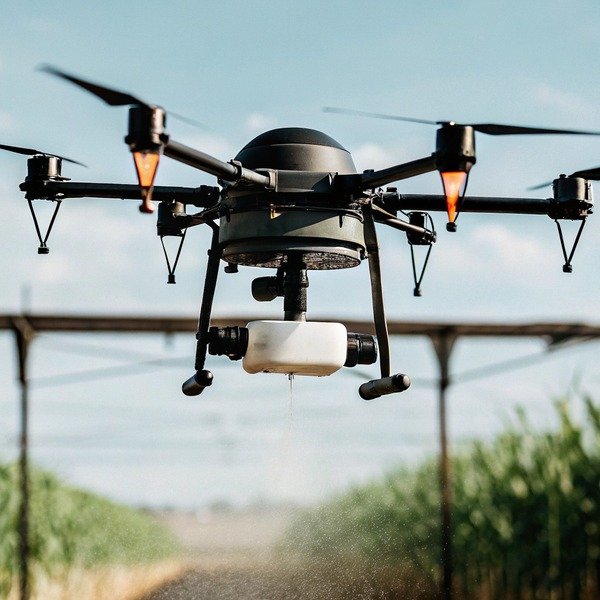
In the world of drone manufacturing, a "cycle" refers to one complete sequence of takeoff and landing. For a photography drone, this might happen once every 30 minutes. However, in agriculture, the operational profile is vastly different. A drone carrying a 30-liter tank empties its payload in 10 to 12 minutes. 30-liter tank 3 It lands, gets a battery swap and a refill, and takes off again. This happens 40 to 50 times a day per machine during the busy season.
When we analyze competitor products that fail, the issue is rarely a single catastrophic event. Instead, it is cumulative fatigue. The landing gear absorbs the shock of the drone's weight plus the remaining liquid payload repeatedly. If a supplier provides data based on standard logistics drone usage (perhaps 5 cycles a day), that data is useless for agriculture. You need proof that the gear can handle the high-frequency rhythm of farm work.
The Hidden Danger of Aluminum Fatigue
Many landing gear struts are made from aluminum alloys due to their cost-effectiveness and light weight. However, aluminum has a specific characteristic: it has no fatigue limit. fatigue limit 4 fatigue limit 5 This means that even small stresses, if repeated enough times, will eventually cause the metal to crack.
When reviewing test reports, you must look for the "S-N Curve" (Stress-Number of cycles) specifically for the alloy used. If the report stops at 1,000 cycles, you are flying blind. We push our testing rigs to 15,000 cycles or more. This ensures that the microscopic changes in the metal structure do not propagate into visible cracks during the machine's service life. If a supplier cannot show you data beyond 2,000 cycles, they likely designed the drone for hobbyist use, not industrial application.
Cycle Count vs. Operational Reality
It is also vital to understand what constitutes a "successful" cycle in these reports. Some manufacturers count a cycle as successful if the leg doesn't snap. However, we define success as zero plastic deformation. If the leg bends by even 1 millimeter after 5,000 landings, the geometry of the drone changes. This affects the calibration of the radar and spray nozzles.
Below is a guide to help you interpret cycle data based on your operational needs.
Table 1: Minimum Recommended Fatigue Cycles by Usage Intensity
| Operational Intensity | Daily Flights (Avg) | Annual Cycles (Est) | Min. Test Cycles Required | Risk Level with Standard Gear |
|---|---|---|---|---|
| Light Duty (Spot Spraying) | 10 – 20 | 1,500 – 2,000 | 5,000+ | Low |
| Medium Duty (Small Farms) | 20 – 35 | 3,000 – 4,500 | 8,000+ | Moderate |
| Heavy Duty (Commercial Fleet) | 40 – 60 | 6,000 – 8,000 | 15,000+ | Critical |
| Continuous Ops (24hr Shift) | 60+ | 10,000+ | 20,000+ | Extreme |
Always ask for the "Cycle to Failure" number, not just the "Test Duration." A test that stops at 5,000 cycles without failure is good, but a test that ran to failure at 18,000 cycles gives you a definitive lifespan cap.
How does maximum payload capacity influence the vertical impact resistance metrics I need to check?
A heavy drone hitting the ground hard is a physics problem that destroys weak frames. Our engineering team constantly adjusts strut stiffness to handle full tanks slamming down during emergency landings or rapid descents.
As payload capacity increases, the vertical impact resistance metric must scale non-linearly to absorb higher kinetic energy. You should verify that the landing gear is rated to withstand peak impact forces of at least 2.5 times the Maximum Takeoff Weight (MTOW) during drop tests from heights of 30 centimeters.

The Physics of Heavy Impacts
When you move from a 10-liter drone to a 50-liter drone, you aren't just adding weight; you are multiplying the kinetic energy involved in every landing. kinetic energy 6 Kinetic energy is calculated as Kinetic energy 7 $E_k = \frac{1}{2}mv^2$. Because agricultural drones often descend quickly to maximize efficiency, the velocity ($v$) at impact can be significant.
If a 50kg drone lands with a descent rate of 1 meter per second, the landing gear must absorb a tremendous amount of energy instantly. If the gear is too rigid, that energy transfers directly to the carbon fiber frame, causing micro-fractures. carbon fiber frame 8 If it is too soft, the drone bottoms out, damaging the spray tank or sensors.
Understanding G-Force Ratings
When we conduct drop tests, we use load cells (sensors that measure force) placed under the landing gear. We are looking for the "Peak Impact Force." On a spec sheet, this might be expressed in Newtons or as a G-force multiple.
For a heavy-lift agricultural drone, a rating of "1G" (holding its own weight) is meaningless. The gear must withstand dynamic shock. We recommend looking for a rating of at least 2.5G to 3G. This means if your drone weighs 50kg fully loaded, the gear should be able to withstand a momentary force of 125kg to 150kg without buckling.
The "Slosh" Factor
One specific metric often missing from generic reports is the impact of liquid payload movement. Unlike a solid cargo box, liquid fertilizer moves. When a drone hits the ground, the liquid in the tank continues to move downward, creating a secondary impact spike milliseconds after the initial touchdown.
We call this the "Water Hammer Effect" in landing dynamics. Standard drop tests use solid weights because they are easier to manage in a lab. However, you should ask your supplier if their vertical impact data includes "fluid dynamics" or if they used a liquid payload during the test. Gear tested only with solid weights may fail under the specific surging stress of a liquid tank.
Table 2: Recommended Impact Force Ratings by Payload Class
| Drone Capacity | Max Takeoff Weight (MTOW) | Min. Peak Force Rating (Newtons) | Drop Test Height (Min) | Key Structural Risk |
|---|---|---|---|---|
| 10 Liters | ~25 kg | > 650 N | 20 cm | Joint Cracking |
| 30 Liters | ~55 kg | > 1,500 N | 30 cm | Tube Bending |
| 50 Liters | ~90 kg | > 2,500 N | 40 cm | Frame Fracture |
| 70+ Liters | ~120 kg | > 3,500 N | 50 cm | Hydraulic Failure |
If the data sheet does not specify the drop height or the payload type (solid vs. liquid), the impact rating is likely inflated. Always assume the worst-case scenario: a full tank landing on hard soil.
Which material stress indicators suggest the landing gear will survive long-term heavy-duty use?
Materials react differently when exposed to moisture and vibration over time. We often reject alloy samples that look strong on paper but fail our microscopic corrosion-fatigue analysis after environmental chamber testing.
The most critical stress indicators are the micro-crack propagation rate and the fatigue limit on the S-N curve. For composite materials, check for delamination resistance data, while aluminum components require corrosion-fatigue interaction metrics that show structural integrity retention after exposure to moisture and caustic chemical fertilizers.

Carbon Fiber vs. Aluminum Stress Markers
Most high-end agricultural drones use a mix of carbon fiber tubes and aluminum joints. These two materials fail in very different ways, and you need to look for different data points for each.
For Carbon Fiber, the danger is delamination. This is where the layers of the composite separate internally. You cannot see this with the naked eye. The relevant test metric here is "Interlaminar Shear Strength" (ILSS) after fatigue cycling. If the ILSS drops by more than 10% after 1,000 cycles, the tubes will eventually shatter under a normal load. We use ultrasonic scanning to verify this, and you should ask if the supplier performs non-destructive testing (NDT) on their fatigue samples.
For Aluminum (usually 7075 or 6061 series), the key metric is "Crack Propagation Rate." Once a microscopic crack forms, how fast does it grow? In a high-vibration environment like a drone, a micro-crack can become a catastrophic failure in just a few flight hours.
Corrosion-Fatigue Interaction
This is an area where we see many generic drones fail. Agricultural environments are harsh. The landing gear is constantly exposed to pesticides, fungicides, and fertilizers, many of which are corrosive.
Standard fatigue tests are done in clean, dry labs. However, when aluminum is corroded, its fatigue limit drops drastically—sometimes by 50% or more. This phenomenon is called "Corrosion-Fatigue."
When reviewing material specs, look for "Salt Spray Test" results combined with load testing. A report that says "Passed 500 hours Salt Spray" is good for rust, but a report that says "Retained 90% Load Capacity after Salt Spray" is what you actually need. This proves that the chemical exposure hasn't weakened the metal's ability to handle landings.
Vibration Resonance Data
Another stress indicator involves vibration. Every structure has a "natural frequency." natural frequency 9 If the drone's motor vibration matches the landing gear's natural frequency, resonance occurs. This acts like an invisible hammer beating on the structure thousands of times per second.
Advanced test reports will include a "Vibration Transmissibility" graph. You want to see that the landing gear's natural frequency is far away from the operating frequency of the motors (usually 60-100 Hz for large drones). If these numbers overlap, the gear will fail prematurely due to vibrational stress, regardless of how good the material is.
Table 3: Material Stress Metrics Checklist
| Component Material | Primary Failure Mode | Key Test Data to Request | Warning Sign in Reports |
|---|---|---|---|
| Carbon Fiber | Delamination | Interlaminar Shear Strength (ILSS) | No ultrasonic/X-ray validation |
| Aluminum Alloy | Fatigue Cracking | S-N Curve & Crack Propagation Rate | No cycle count specified |
| Joints/Mounts | Loosening/Shear | Torque Retention after Vibration | "Static Load" only |
| Coatings | Chemical Corrosion | Post-Corrosion Load Capacity | Visual inspection only |
Do standard laboratory fatigue tests accurately reflect the wear and tear of uneven farmland terrain?
A flat concrete floor in a lab is nothing like a muddy, furrowed cornfield. Our field testing in Chengdu proves that real-world forces come from unpredictable angles, creating shear stresses that standard vertical drop tests completely miss.
Standard laboratory tests often fail to predict field failures because they apply vertical loads evenly. You need test data that includes asymmetrical impact simulations, where one leg strikes the ground before the others, creating lateral shear forces that mimic landing on sloped or furrowed agricultural land.

The Myth of the Flat Landing
In a laboratory, a drone is dropped perfectly level onto a flat steel plate. The force is distributed equally across all four (or six) landing legs. This is the "ideal" scenario.
In the real world, a farmer lands on a dirt road with potholes, a sloped hill, or directly over a crop furrow. In these scenarios, one leg hits the ground first. This singular leg momentarily supports the entire weight of the drone plus the impact inertia. Furthermore, because the ground is uneven, the force isn't just vertical; it pushes the leg sideways.
Lateral Shear and Splay Forces
These sideways forces are called "Lateral Shear." Standard landing gear is designed to be strong vertically (compression). However, many designs are weak horizontally. When a heavy drone lands on a slope, the legs want to "splay" or spread outward.
If the test data only includes "Vertical Compression," it is insufficient. You must look for "Side-Load" or "Lateral Static Load" tests. For example, we test our gear by applying force from the side to simulate a 15-degree slope landing. This ensures the mounting brackets—where the gear connects to the main body—won't snap off when the drone lands awkwardly.
Hybrid Testing: The Gold Standard
Because we know lab tests have limits, we advocate for a hybrid testing approach. A responsible manufacturer should provide data from both the lab (for consistent, repeatable benchmarks) and the field (for real-world validation).
Field data usually appears in reports as "Flight Test Hours" in specific environments. Look for notes regarding:
- Terrain Variety: Was it tested on concrete only, or also on soft soil and gravel?
- Wind Conditions: High winds force the drone to land at an angle (crab landing), which puts immense twisting stress (torque) on the landing gear.
- Fastener Integrity: Field reports should track how often screws and bolts need tightening. In the lab, bolts rarely loosen. On a farm, vibration and uneven landings loosen bolts rapidly.
Why "Tip-Over" Resistance Matters
Uneven terrain also increases the risk of tipping over. While this sounds like a pilot error, the landing gear design plays a huge role. Wider stances and flexible "feet" can absorb the unevenness better than rigid skids.
Test data related to "Static Tilt Angle" tells you how steep a slope the drone can land on before falling over. A higher angle (e.g., 25 degrees) indicates a more stable, ground-hugging center of gravity, which generally correlates with better uneven terrain durability.
H3: Comparing Test Environments
| Test Type | Force Direction | Scenario Simulated | Limitation |
|---|---|---|---|
| Standard Lab Drop | 100% Vertical | Perfect landing pad | Ignores side forces |
| Asymmetrical Drop | Single-leg focus | Hitting a rock/furrow | Hard to standardize |
| Side-Load Test | Horizontal/Lateral | Landing on a slope | Static (doesn't capture impact) |
| Field Endurance | Multi-axis (Random) | Real farming conditions | Variables are uncontrolled |
Ultimately, do not trust a certificate that only cites ISO lab standards. ISO lab standards 10 Ask the supplier: "How does this gear perform when it lands on a 15-degree slope with a full tank?" Their answer—and the data they back it up with—will tell you everything you need to know.
Conclusion
Selecting the right agricultural drone requires looking beyond flight time and spray width. The fatigue data of the landing gear is the best predictor of whether a machine will last five years or five months. By insisting on reports that show high-cycle fatigue survival, non-linear impact resistance, and asymmetrical terrain testing, you protect your investment from costly downtime. We believe transparency in testing is the foundation of trust, and we encourage you to demand raw data from your suppliers.
Footnotes
1. IEEE research on automated battery swapping systems for industrial drones. ↩︎
2. FAA provides guidelines on structural integrity and maintenance for commercial UAS operations. ↩︎
3. DJI’s Agras T30 is a benchmark for 30-liter agricultural drone specifications. ↩︎
4. Explains the fundamental material science concept of stress levels below which failure does not occur. ↩︎
5. Defines the metallurgical concept explaining why aluminum eventually fails under stress. ↩︎
6. EASA defines safety requirements and kinetic energy thresholds for drone categories. ↩︎
7. Official NASA explanation of the physics formula used to calculate impact force. ↩︎
8. Toray is a leading manufacturer of carbon fiber used in high-performance drone frames. ↩︎
9. Background on the physical concept of resonance and natural frequency in structures. ↩︎
10. Links to the International Organization for Standardization mentioned regarding testing protocols. ↩︎